Buy a Thai condo on evidence, not influencers.
Every for-sale and for-rent condo we can find — yields against the Bank of Thailand mortgage rate, foreign-quota inventory, district flood risk, cross-portal price divergence. Ask anything and we cite the building.
Want a human read on the Bangkok condo market?
We pair you with a vetted broker who knows the building, the sub-market, and the foreign-quota status. We don’t take commissions from developers; the broker pays us a flat referral.
Most-overpriced vs district — verify before buying
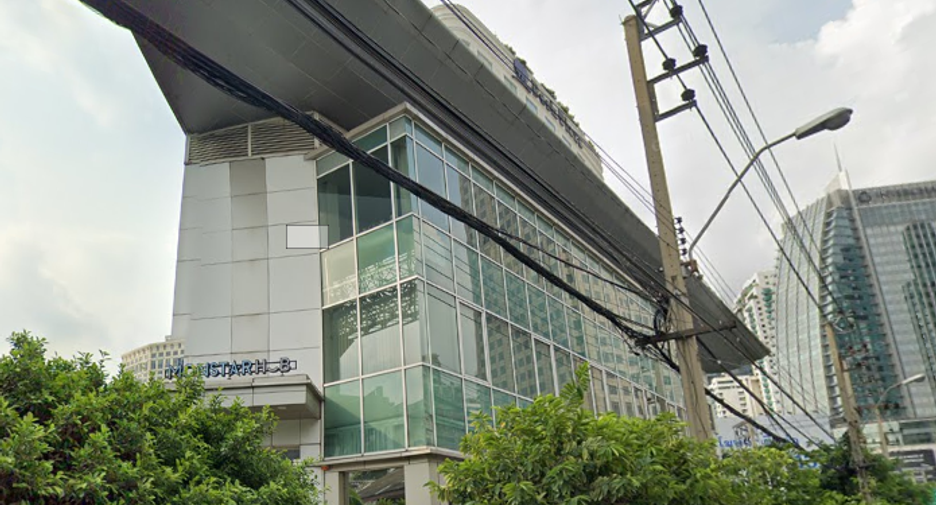
Same khet, same square meter — these cost 3-4× the local average
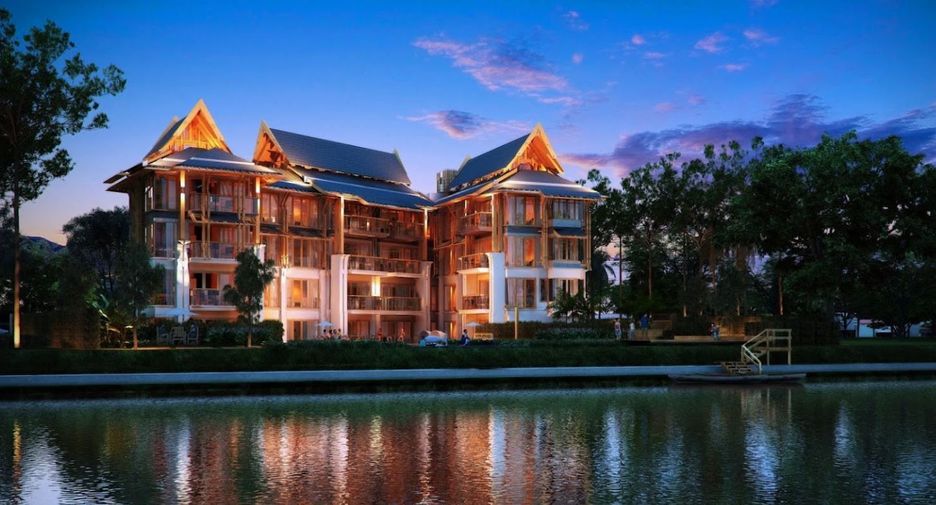
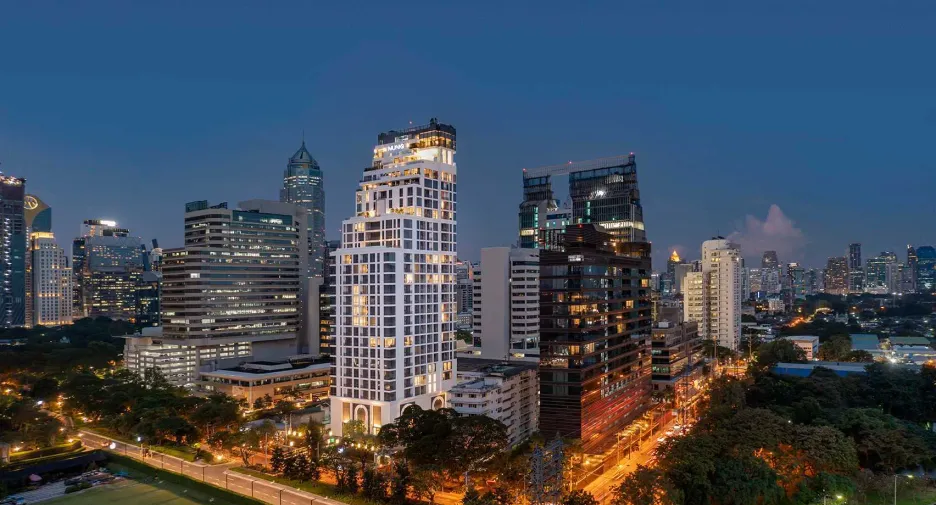
Districts that stayed dry in 2011 + every monsoon since
Flood Level 1/5 — central elevated, robust drainage

What we surface
Every condo with enough sale + rent data, ranked by gross yield against the current Thai mortgage rate. Spread positive = rent covers the mortgage.
Bank of Thailand policy rate, MRR, MLR, MOR, deposit max — the floor on every mortgage product. Updated daily.
Monsoon flood risk for every Bangkok district on a 0–5 scale, with every condo plotted as a dot in its risk colour.
Influencer / ad claims placed next to our measured data. Bubble Index verdict per building.
Yellow dots = buildings with lat/lng. Click a dot for the full data report.
Curated yield slices
Hand-curated cuts — by city and budget — ranked against the current Thai mortgage rate.
Area data
Yields, common-area fees and head-to-head area comparisons, measured from live listings.
Other markets we cover
Same data engine, different cities. Phuket, Chiang Mai, Pattaya, Hua Hin, Chonburi, Krabi, Koh Samui, Chiang Rai.
Frequently asked questions
What is RealData?▾
Independent measurement of every Thai condo we can find — sale prices, rents, yields, amenities, BTS/MRT distance, flood risk, foreign-quota inventory. Across Bangkok and 8 secondary cities. The message: don't buy because an influencer recommended it. Verify with data first.
Where does the data come from?▾
Listings: hipflat, dotproperty, ddproperty, fazwaz (cross-checked). Macro rates: Bank of Thailand BTWS_STAT. Flood: BMA Drainage Department + JICA reports + 2011 great flood inundation records. Infra & transit: OpenStreetMap (Overpass API). Air quality: WAQI. All public data, ToS-compliant.
What is the Bubble Index?▾
(building's price-per-sqm ÷ district average price-per-sqm) × 100. 100 = at market. 200 = double the average. Below 80 = underpriced; above 130 = bubble suspect.
What is gross rental yield and how is it computed?▾
(12 × median monthly rent ÷ median sale price) × 100%. Only buildings with at least 2 sale and 2 rent listings count. USD-priced rows are converted to THB first. Outliers above 25% are dropped as price-parse errors. Net yield is typically 1.5–3pp lower after CAM, vacancy, and management.
Can a foreigner own this condo?▾
Thai law caps foreign ownership at 49% of a building's floor area. The remaining 'foreign quota' varies per project. We surface each FazWaz building's measured foreign-quota inventory share — the % of for-sale units still flagged Foreign Quota — so you can see at a glance whether a building is foreign-buyable.
How does RealData make money?▾
Two ways, and neither one can touch a measurement. We carry standard display advertising, served by an ad network that has no access to our data and no say in what it says — the same wall a newspaper keeps between its ad pages and its newsroom. And when a reader asks for an expert opinion via the contact form, we route the lead to one vetted independent broker who knows the sub-market; the broker pays us a flat referral if a deal closes, and the reader pays nothing extra. What we never take is developer money: no paid placement, no sponsored rankings, no building buying its way up a list.
How often is the data refreshed?▾
Bangkok listings refresh daily for new inventory. Full Thailand sweep runs weekly across hipflat, dotproperty, ddproperty, fazwaz. Yields and bubble index recompute after every ingest cycle. BOT macro rates refresh daily. Flood layer reviews annually. Each building page shows its own measurement timestamp.
What is the typical rental yield for condos in Bangkok?▾
Gross rental yields for Bangkok condos measured by RealData typically range from 3% to 7%, with a median around 4.5–5%. Central districts like Silom and Sukhumvit tend toward 3.5–5% due to higher sale prices, while outer areas like Lat Phrao and Phra Khanong can reach 5–7%. Net yield is typically 1.5–3 percentage points lower after CAM fees, vacancy, and management costs.
How much does a condo in Bangkok cost?▾
Bangkok condo prices span a wide range: studios and 1-bedroom units in outer districts start from ฿1.5–3M (≈$40,000–85,000). Mid-market central condos (Asok, Phrom Phong, Ari) run ฿4–10M. Premium high-rise units in Silom or Sukhumvit start from ฿10M and can exceed ฿50M. The Bubble Index on each building page shows whether a specific condo is priced above or below its district average.
What is the 49% foreign ownership rule for Thai condos?▾
Thai law (Condominium Act Section 19) caps total foreign ownership in any condo building at 49% of total floor area. This means foreigners can only buy units in the 'foreign quota' — the portion up to 49% — and once full, the building is closed to new foreign purchases. RealData surfaces the measured foreign-quota inventory share per building from FazWaz listings, so buyers can check whether a project still has foreign-eligible units.
Which Bangkok districts are best for condo investment?▾
Based on RealData measurements, districts combining low flood risk with above-average yields include Phra Khanong (On Nut / Ekkamai area), Bang Na, and Khlong Toei. Sukhumvit central (Asok to Phrom Phong) has lower yields but strong resale liquidity. For budget buyers, Lat Phrao and Chatuchak offer yield-to-price ratios above the city median. Each district page shows median yield, median sale price, and flood risk for every tracked building.